Viewing the Service Dashboard Charts and Graphs
The Service Dashboard is an interactive, data-driven, visual monitoring tool of your site's current service jobs. When you select a level (or levels) from the Level Structure panel, the dashboard will populate statistics of all current service jobs that relate to the selected levels. The Y-Axis measures the number of jobs; X-Axis indicates the different job types. You can customize the Service dashboard to your personal preference by clicking on individual items on the dashboard to either get more details, or hide elements you do not need to see.
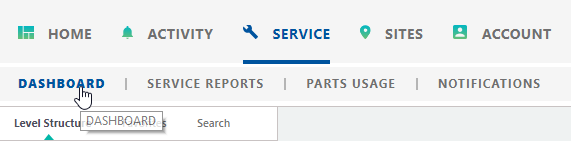
![]() To access the Service Dashboard, click Service from the Navigation bar, and select Dashboard
To access the Service Dashboard, click Service from the Navigation bar, and select Dashboard
Populating the Service Dashboard Charts and Graphs
-
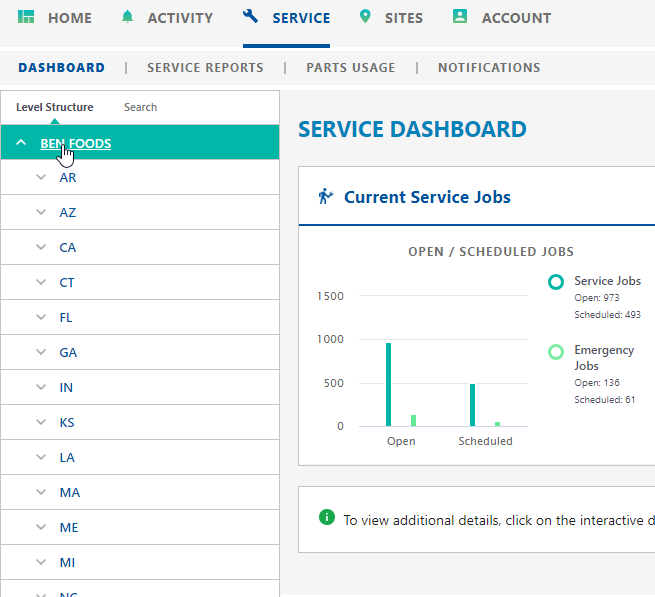
From the Service Dashboard, select desired level the Level Structure panel. The level-specific service jobs will populate in the dashboard panel.
-
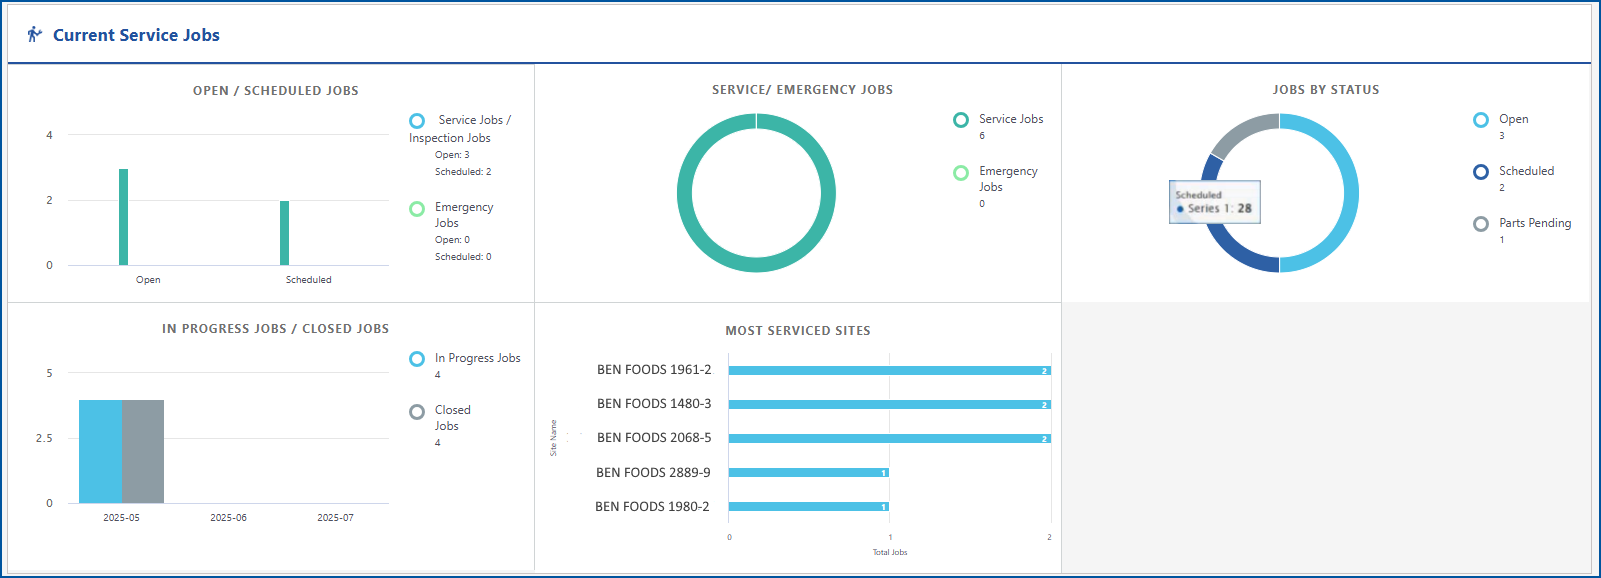
Hover over any item in the dashboard to view basic information
Open/Schedule Jobs - Shows all Service and Inspection jobs that are open or scheduled
Service/Emergency Jobs - Shows all Service jobs that are marked as normal or emergency
Jobs By Status - Shows all Service and Inspection jobs by statuses
In Progress Jobs/Closed Jobs - Shows Service and Inspection jobs that are not closed and closed within the past 3 months
Most Serviced Sites - Shows top 5 sites with the most opened Service Jobs
-
To hide a service job type from the dashboard views, click on the description legend

-
To view detailed information, click on any bar or pie chart in the dashboard and detailed information will populate in a grid below the dashboard.
No Data Available
![]() If you have no current Service Jobs, the Dashboard charts will display "zeroed" out, and the view functionality will be disabled.
If you have no current Service Jobs, the Dashboard charts will display "zeroed" out, and the view functionality will be disabled.
