24 Hour Activity Dashboard (Home Page)
Applies to: Monitored systems enrolled in the DataSource Enrollment tier
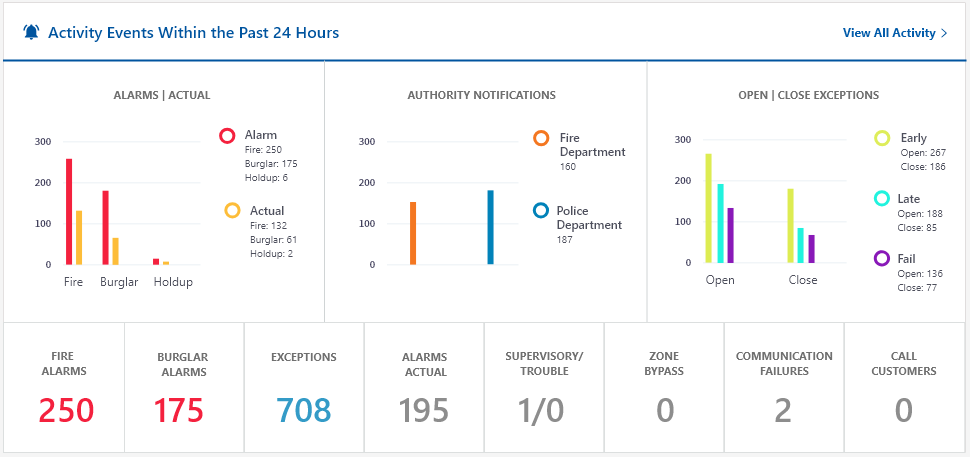
The Activity Events Dashboard (on the Home Page) provides an at-a-glance, data-driven, visual monitoring of your site's activities in the last 24 hours. On the charts row, the Y-Axis measures the number of sites and activities; X-Axis indicates the different activity types. If you want to access more in-depth or filtered information, you can click on the View All Activity link on the upper right hand side. Learn more about Activity Dashboards in DataSource.