Viewing the Activity Dashboard Charts & Graphs
Applies to: Monitored systems enrolled in the DataSource Enrollment tier
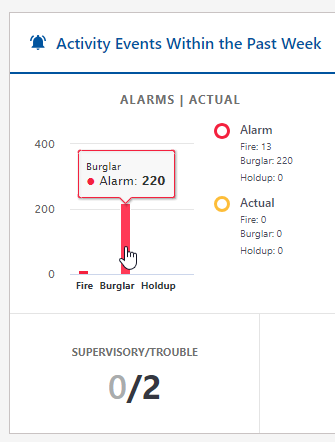
The Activity Dashboard provides an interactive, data-driven, visual monitoring of your site's activities of the course of the week- or 24 hours -(depending on which view you choose. When you select a Site level and activity type, the graph will show the results based on the data and duration. The Y-Axis measures the number of sites and activities; X-Axis indicates the different activity types.
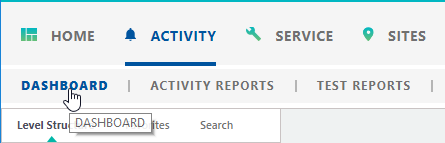
![]() To access the Activity Dashboard, click the Activity link from the Navigation bar, select Activity Dashboard
To access the Activity Dashboard, click the Activity link from the Navigation bar, select Activity Dashboard
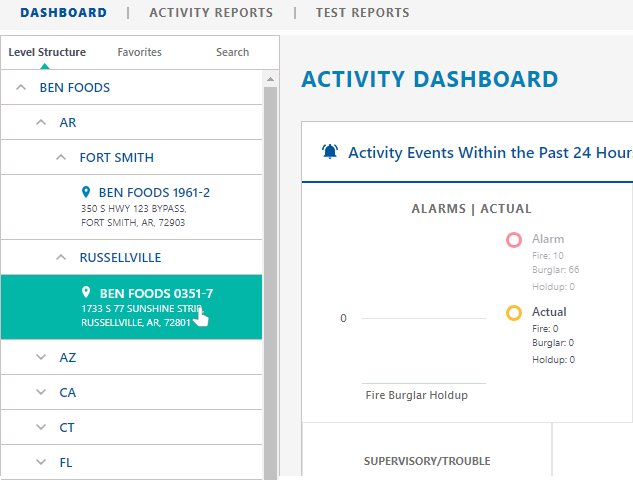
1. From the Level Structure panel, select the desired levels to include in the graph. You can search levels using the Level Structure, Favorites, or Search tab. The level selected will populate data in the Activity Dashboard chart/////.
In this example, the user can see all of the events that happened within the past week.
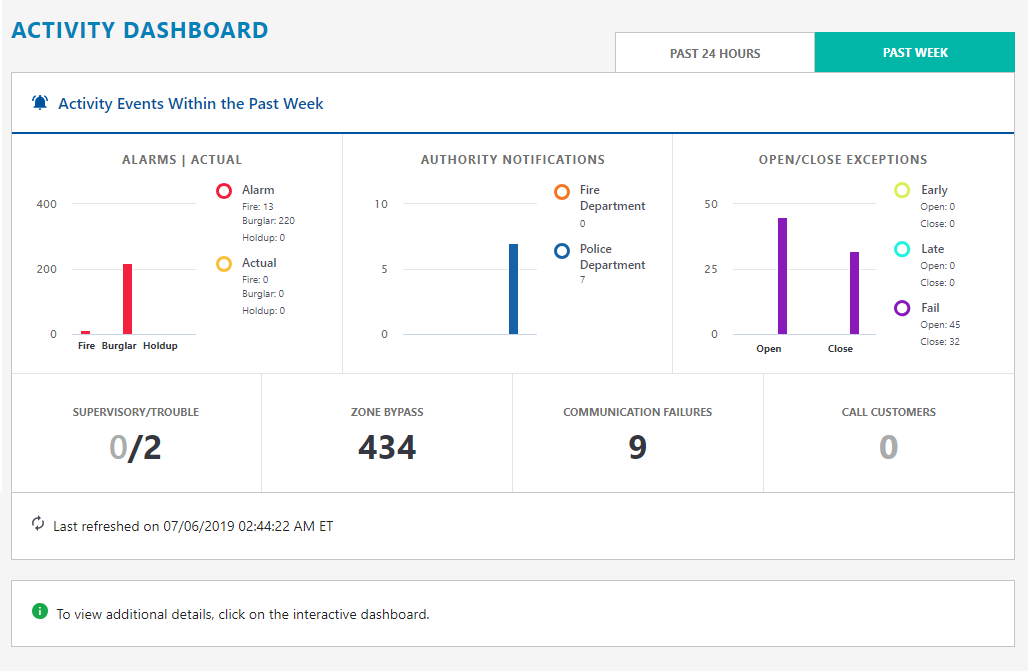
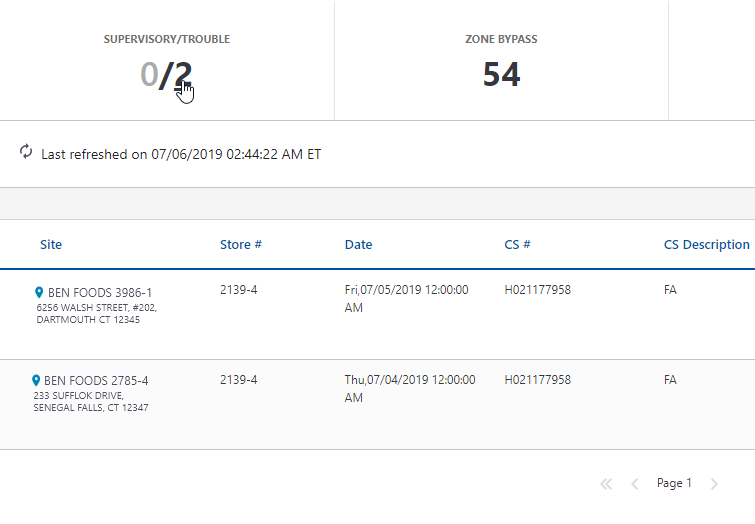
2. To view more extensive data (Site, Store, CS#, Date/Time, Zone ID, etc), click the individual bars in the chart or desired category numbers . The event details are shown in the Dashboard Grid panel that populates below the charts.
Clicking on Bar Charts
Clicking on Numbers
3. To show/hide data, you can click on the legends next to the bars in the chart.
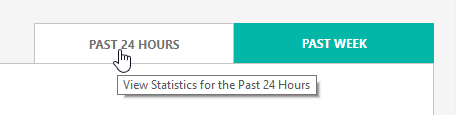
4. To change the time frame for the dashboard, you can toggle between Past Week and Past 24 Hours tabs in the upper-right-hand corner.
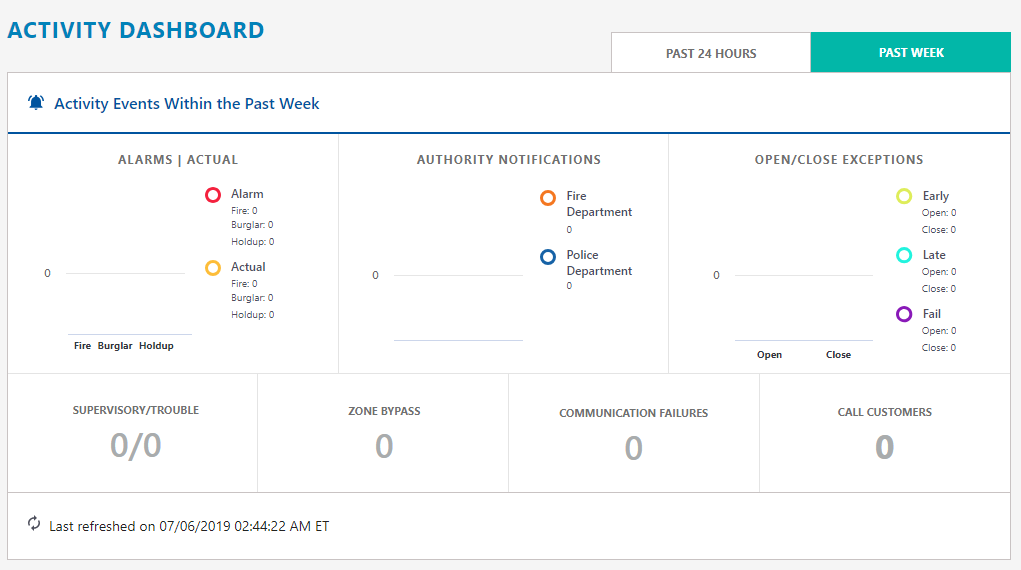
No Data Available
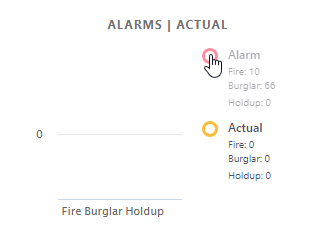
![]() If you have no Activity, the Dashboard charts will display "zeroed" out, and the grid/view functionality will be disabled.
If you have no Activity, the Dashboard charts will display "zeroed" out, and the grid/view functionality will be disabled.