Running an Activity Reports Search - Events & Exceptions
Applies to: Monitored systems enrolled in the DataSource Enrollment tier
The Activity Report Search panel generates alarm and test activity results for events and exceptions that occur at your site, outside of a site's normal daily activities. There are two types of activity reports that can be created; Activity Events and Activity Exceptions. Generating the Activity Events report populates various alarm & test activities that occur at your site, and the Alarm Activity Exception report renders activities that occur outside of normal activity (e.g. notify PD, notify FD, etc.). For each report type, you would select the desired activity type to include in the results.
* Even though both reports appear in the Alarm Activity section, you can only run one report at a time and should be treated as separate reports.
-
Alarm Activity - Displays the alarm activity that has taken place at the site.
-
Test Activity - Displays the test activity that has taken place at the site. It would show sites that did not have any test signals; where no panels were tested.
-
Alarm & Test Activity - Displays both the alarm & test activity that has taken place at site.
![]() To access the Activity Report Search section, click Activity from the Navigation bar and select the Activity Reports tab.
To access the Activity Report Search section, click Activity from the Navigation bar and select the Activity Reports tab.
Click the desired area in the image to display more information.
Events Search
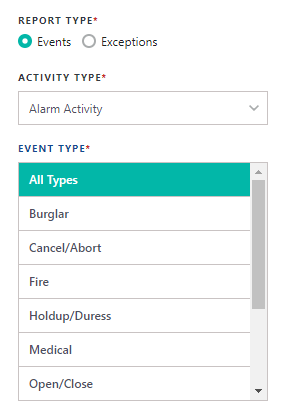
![]() Events display the activity events by Alarm Activity, Test Activity or both. If you selected a site level, all sites that are associated within the site level will be included. The activity is sorted in descending order by date and time. Each alarm activity event lists the type of alarm activity that occurred, zones affected and tested, user ID, and comments.
Events display the activity events by Alarm Activity, Test Activity or both. If you selected a site level, all sites that are associated within the site level will be included. The activity is sorted in descending order by date and time. Each alarm activity event lists the type of alarm activity that occurred, zones affected and tested, user ID, and comments.
1. Select Events radio button in the Report Type field.
2. Select Activity Type
3. Select Event Type(s). For multiple selections, use the SHIFT key to select in sequential order; use the CTRL key to select in non-sequential order.
Exceptions Search
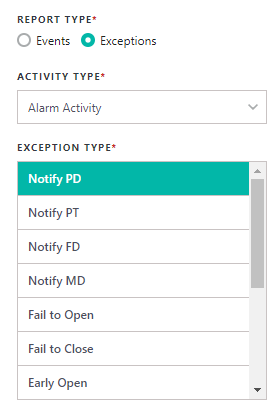
![]() Exceptions display the activity events by Alarm Activity, Test Activity or both. You must select the exception type(s) you wish to run reports on, including Notify PD/PT/FD/MD, Failure to Open/Close, Early or Late Open/Close, Bypass Zone, Call Customer and Timer Test Failure.
Exceptions display the activity events by Alarm Activity, Test Activity or both. You must select the exception type(s) you wish to run reports on, including Notify PD/PT/FD/MD, Failure to Open/Close, Early or Late Open/Close, Bypass Zone, Call Customer and Timer Test Failure.
1. Select Exceptions radio button in the Report Type field.
2. Select Activity Type
3. Select Exception Type(s). For multiple selections, use the SHIFT key to select in sequential order; use the CTRL key to select in non-sequential order.
4. Select the desired date range setting from the Date Range field.
![]() In the Date Range, you can search within various time frames. Past 24 Hours and Past Week will auto-populate the start and end dates.
In the Date Range, you can search within various time frames. Past 24 Hours and Past Week will auto-populate the start and end dates.
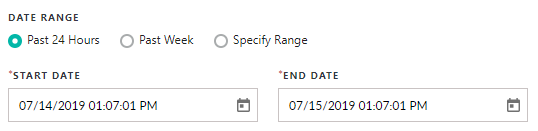
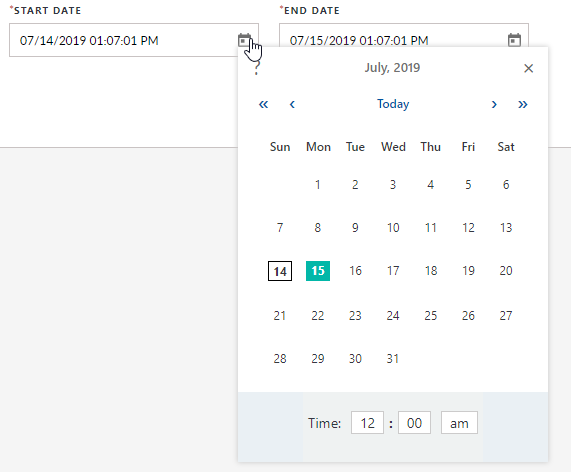
5. If you select Specify Range, it will allow you to use a calendar picker feature to select year, month and date.
-
Select the desired date range setting from the Date Range field.
-
Select the desired start/end date using the Calendar
 icon.
icon.
6. Click Search to generate the results and the report will appear in a grid format. You will have the ability to download and view the reports once you generate the search results.

Add to My Reports
The Add to My Reports button saves the search parameters for quick access at a later date..
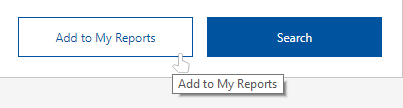
You will be able to access My Reports from the Quick Actions panel on the DataSource home page (in the upper right-hand corner) .