Viewing the Activity Dashboard Grid
Applies to: Monitored systems enrolled in the DataSource Enrollment tier
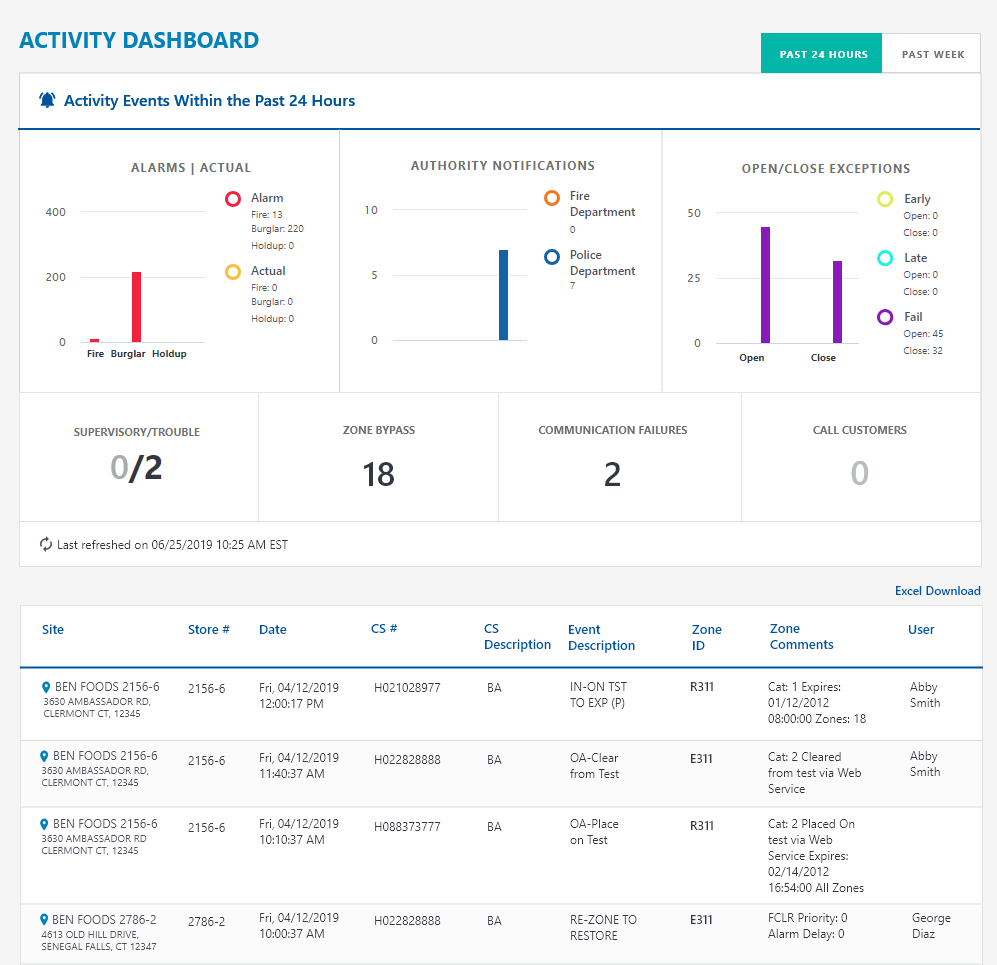
The Activity Grid provides you with details for events that occur at your company sites. When you select an event in the dashboard charts panel, the grid below will populate,displaying specific details (e.g. timestamp of when the event occurred and the system that was affected).
![]() The Dashboard Grid will not populate until you have made a selection.
The Dashboard Grid will not populate until you have made a selection.
View instructions on how to the Navigate Activity Dashboard panel
-
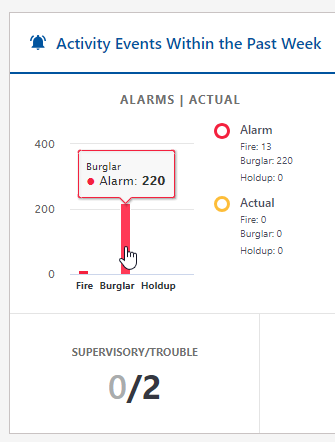
To see select data (Site, Store, CS#, Date/Time, Zone ID, etc) for a particular type of events, click the individual bars in the chart or desired category numbers . The event details are shown in the Dashboard Grid panel that populates below the charts.
-
The Dashboard Grid populates below the chart panel.
Downloading Reports
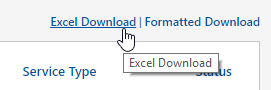
![]() You can download reports in either Excel or Formatted by clicking one of the links in the upper right-hand corner of the grid.
You can download reports in either Excel or Formatted by clicking one of the links in the upper right-hand corner of the grid.
-
-
Excel Download - Already in data rows in an editable Microsoft Excel file
-
Formatted Download - Printable View
-
Pagination
If your report is multiple pages, there will be an active blue arrow ![]() in the pagination.
in the pagination.

On a multi-page report, you have active navigation to return to previous page or return to page 1.

